Explore More Music Tools
 Create beats, melodies, and songs.
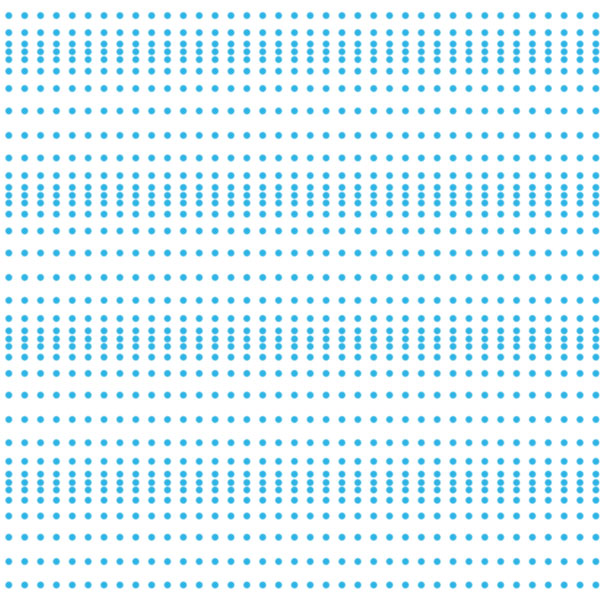
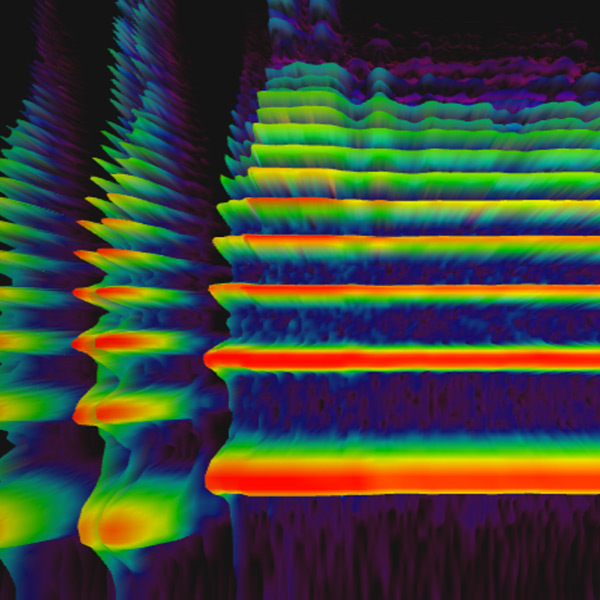 See sound frequencies over time.
 Build repeating percussion patterns.
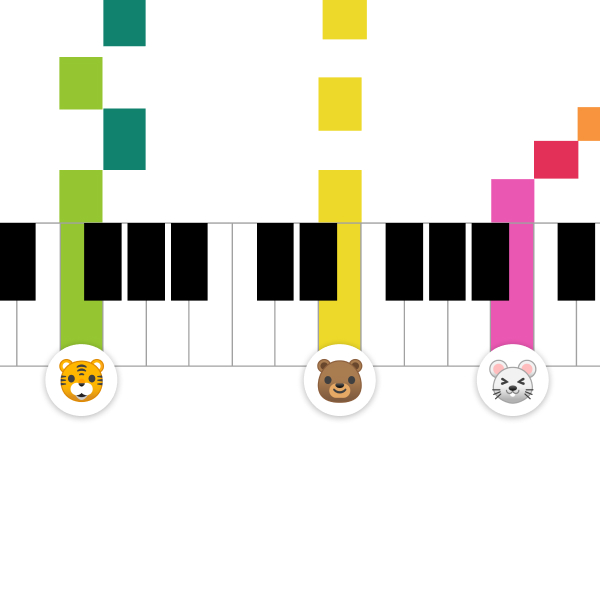
 Make short melodies on a grid.
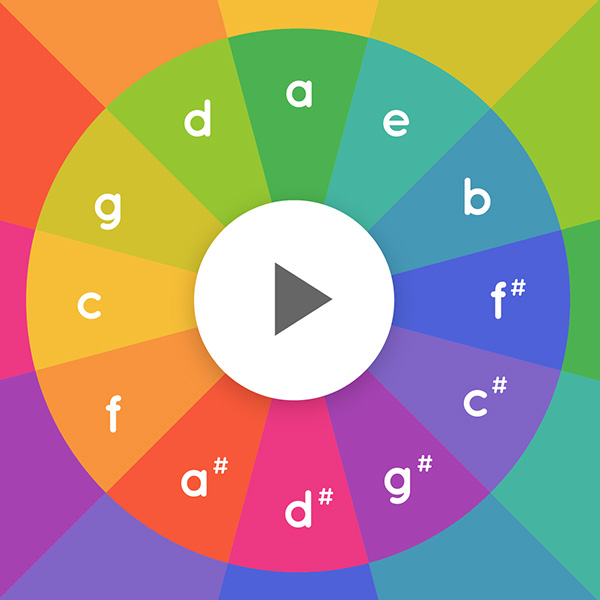
 Hear three-note chord sounds.
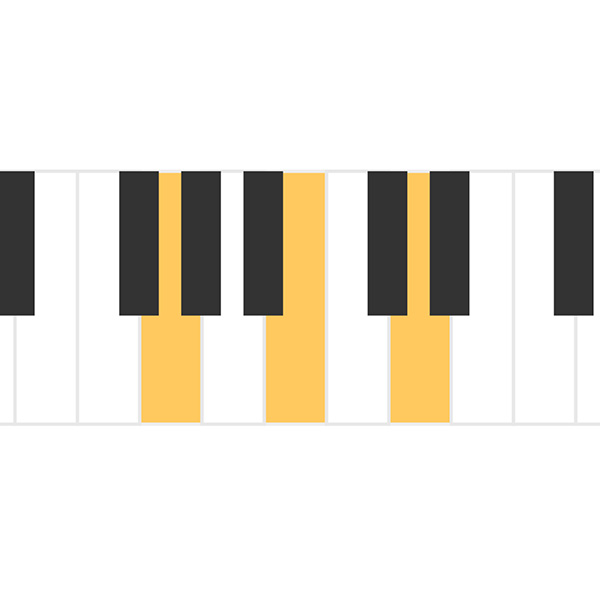
 Play chord tones in patterns.
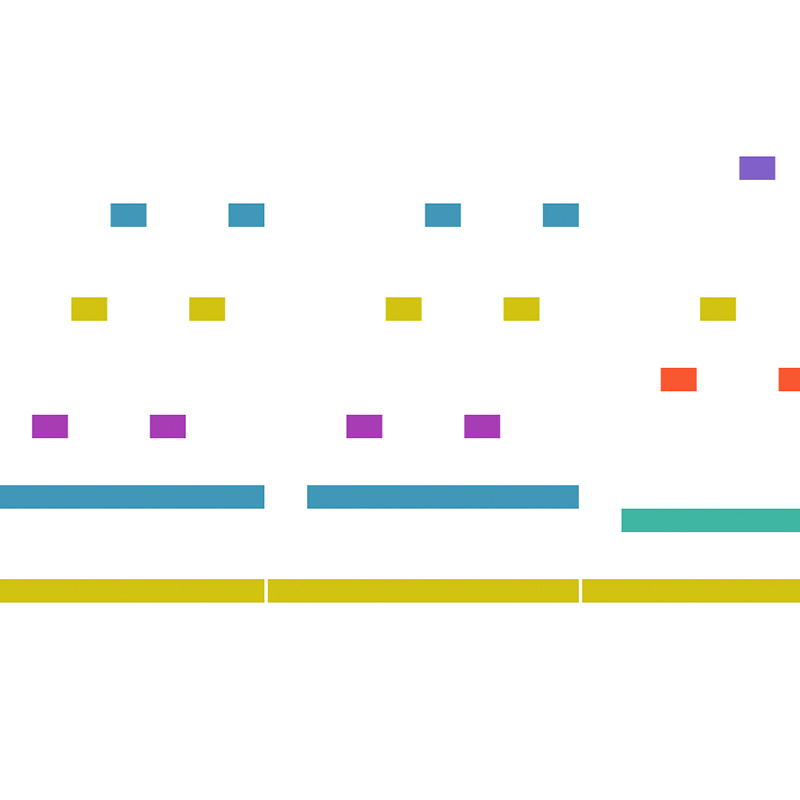 Watch notes flow like a roll.
 Turn drawings into sound.
 Change frequency and wave types.
 See sound move through air.
 Explore overtones and intervals.
 Compare string length and pitch.
 Spin voice speed and direction.
 Share a live piano room.
Free online sound visualizer
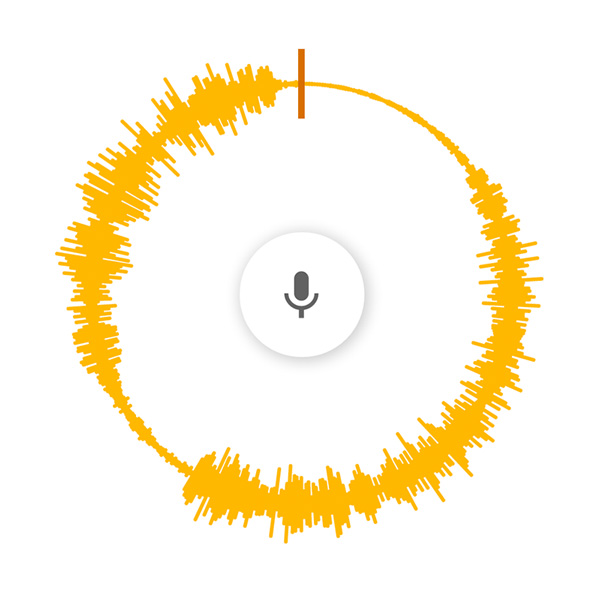
Spectrogram
Use a spectrogram to see sound as a moving picture. Voices, instruments, and everyday noises all create different frequency patterns, making this free online sound visualizer a simple way to compare sounds, use your microphone, or drag in an audio file for visual inspection.
How a Spectrogram Works
A spectrogram maps sound across time and frequency. Lower sounds appear in lower frequency areas, higher sounds appear higher, and brighter areas show stronger parts of the sound. Instead of only hearing a note or noise, you can see how its energy changes moment by moment.
What to Try First
Try speaking, singing, clapping, or playing an instrument near your microphone. You can also drag in an audio file and compare how vowels, whistles, drums, sustained notes, and noise look on screen.
Read Sound by Time and Frequency
Time moves across the display while frequency is arranged from low to high. A bass drum usually appears lower, a whistle appears higher, and a sung note often shows several stacked bands called harmonics.
Use It as an Audio Frequency Analyzer
This online spectrogram can help you inspect voices, music clips, classroom demonstrations, and everyday sounds. It is useful when you want a quick visual explanation of pitch, resonance, overtones, and noise.
Explore Sound Visually
Voice Patterns
See how different vowel sounds, consonants, pitch changes, and breath sounds appear as frequency bands.
Instrument Timbre
Compare instruments by looking at their overtones, attacks, sustain, decay, and texture.
Rhythm and Noise
Watch short sounds like claps, taps, drum hits, clicks, and knocks create quick bursts across the display.
Classroom Experiments
Use the visual display to introduce frequency, amplitude, timbre, and sound waves in a hands-on way.
Common Ways to Use a Spectrogram
Compare High and Low Pitch
Sing a low note and then a high note to see how the main frequency moves upward on the display.
Find Harmonics
Play a sustained musical note and look for repeated bands above the main pitch. These harmonics help create the sound's character.
Inspect Noisy Sounds
Try paper rustling, hand claps, or percussion. Noisy sounds often spread energy across a wide range of frequencies.
Practice Listening Skills
Match what you hear with what you see, then use the visual feedback to describe pitch, brightness, attack, and texture more clearly.
Great for Music and Science
Spectrograms connect music, physics, and listening skills. They make invisible sound details visible, so students can compare what they hear with what they see and build a stronger understanding of sound waves.
No Setup Required
The tool runs in a modern web browser. For live microphone experiments, allow microphone access when your browser asks, or drag in an audio file when you want to inspect a recorded sound.
Tips for Better Results
Use a quiet room when comparing subtle sounds, keep your microphone at a steady distance, and test one sound at a time. Clear input makes the frequency patterns easier to understand.
Works for Quick Experiments
You do not need special audio software to start exploring. Open the spectrogram, choose a sound source, and use the display as a fast visual guide for music, speech, and science activities.
FAQ
What is a spectrogram?
A spectrogram is a visual picture of sound. It shows how different frequencies change over time, making pitch, volume, and texture easier to see.
What can I learn from a spectrogram?
You can compare voices, instruments, and noises by looking at their frequency patterns. It helps explain pitch, overtones, timbre, and how sound changes.
Can I use my microphone?
Supported browsers can use microphone input after you grant permission. This lets you see your voice or nearby sounds as a live spectrogram.
How do I read a spectrogram?
Read a spectrogram from left to right as time passes. Low frequencies appear near the bottom, high frequencies appear near the top, and brighter areas usually show stronger sound energy.
Can a spectrogram show the difference between instruments?
Yes. Instruments with the same pitch can still look different because their overtones, attack, sustain, and noise patterns create different shapes in the spectrogram.
Is this spectrogram free?
Yes. You can open the spectrogram in your browser and explore sound visually without an account or installation.